
The first step in preventing collisions is knowing how and why they happen. With this information, we can take steps to avoid them. Education and enforcement efforts should focus on the most common causes of collisions and fatalities.
In 2016, this organization read through five years (2011-2015) of Corvallis, Oregon police crash reports, to tally the behavioral causes of driver collisions with cyclists and pedestrians. Additionally, we compared Corvallis’s causes with twenty years of findings from similar studies around the country (which essentially became a literature review). All the details of our collision study and literature review are written in this paper, which was released in January 2017.
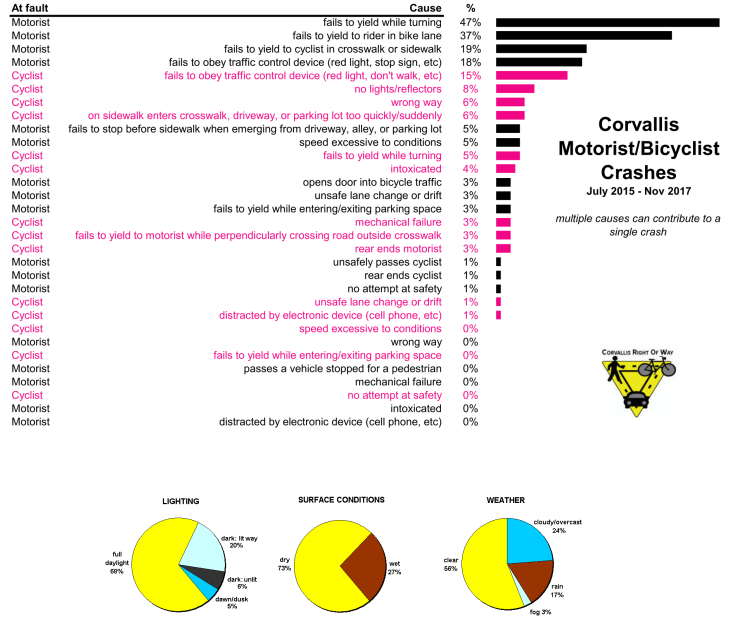
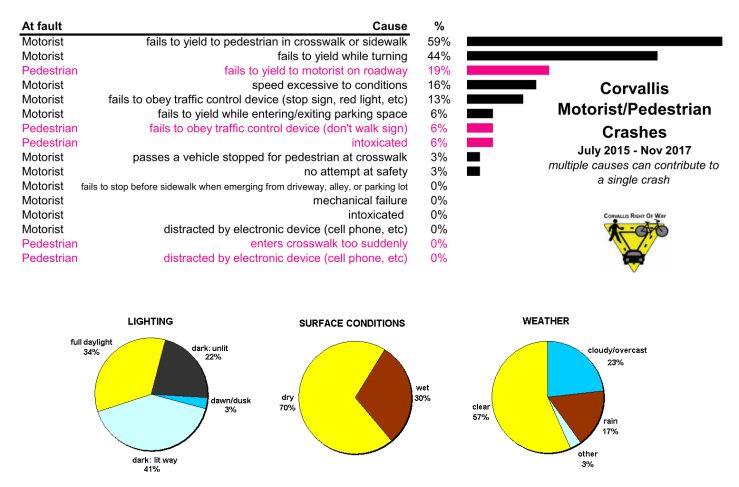
Two years later, we again read through the latest batch (2015-2017) of Corvallis, Oregon police reports. We again tallied the behavioral causes of driver collisions with cyclists and pedestrians, to see if anything had changed. We used the same techniques described in our original collision study (which was released in Jan 2017). For this followup study, there is no new writeup. We only created new graphs for the latest data. Those are the graphs shown below.
The information below summarizes our findings:
A comprehensive Portland study looks into causes of car collisions and fatalities.


.
Corvallis’s data for car/bike collisions is shown below. 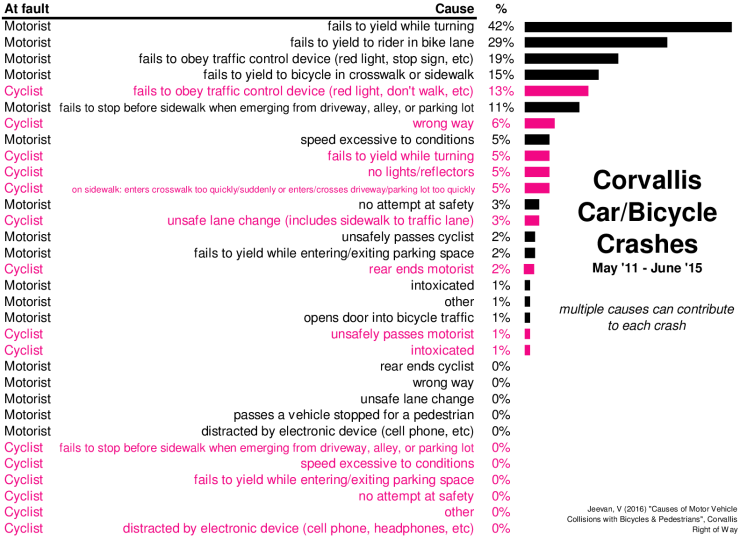
.
For fatalities, there are too few in Corvallis (fortunately) to determine statistics. Throughout the nation, there are very few studies of fatalities. This New York City study is the most recent and comprehensive study on fatalities, and smaller studies conducted afterwards show general agreement.

.
Corvallis’s data on car/pedestrian collisions is shown below.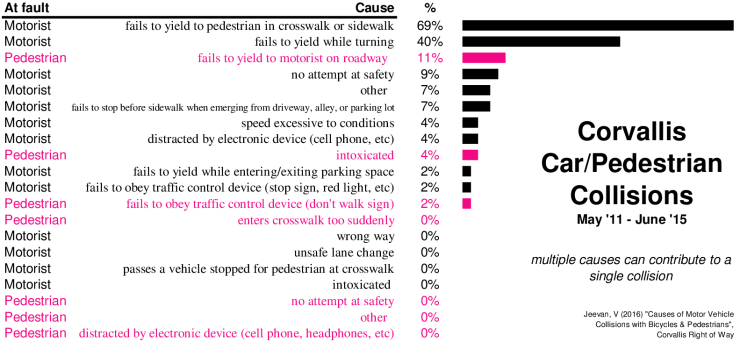
.
CONCLUSIONS
In fatal car collisions, alcohol and drugs are the largest contributor. However, speed and aggressive driving, which are far more accepted in society, each contribute to nearly half of all fatal collisions. Education and enforcement of these issues will drastically save lives.
For bicycles collisions, motorists turning into the path of bicyclists is by far the most common cause of collision, and the #2 cause of fatality. The #1 fatality is from unsafe motorist passing of cyclists. Therefore, education and enforcement of these issues will make the biggest safety difference.
The stereotype of cyclists being reckless is not supported by data. The top 4 causes of bike/car collision and fatality are motorist-caused.
For pedestrians, the data is completely one-sided. Notice how the #1 and #2 issues swamp all other issues. Teaching drivers to look both ways before travelling through a crosswalk or sidewalk, will prevent the most collisions.
For more details on this data and links to numerous similar studies, here is CROW’s full report on the behavioral causes of collisions in Corvallis.
